Business Intelligence and Analytics With Epicor ERP
Epicor ERP can do much more for your business besides helping you plan your resources for existing work and operations. By utilizing the software’s business intelligence and analytics functions, you can uncover problems and find opportunities to grow your business and increase profits. Dashboards, trackers and data visualization tools built into the core ERP platform help you visualize data and get a better understanding of what is happening in your company. You can use Epicor ERP’s operational reports and dashboards to drive deeper into your company’s data. Business activity queries (BAQs) built into Epicor ERP drive reports, dashboards and trackers to help you understand what is happening right now throughout your operations. Through real-time operational queries in Epicor ERP, users can:
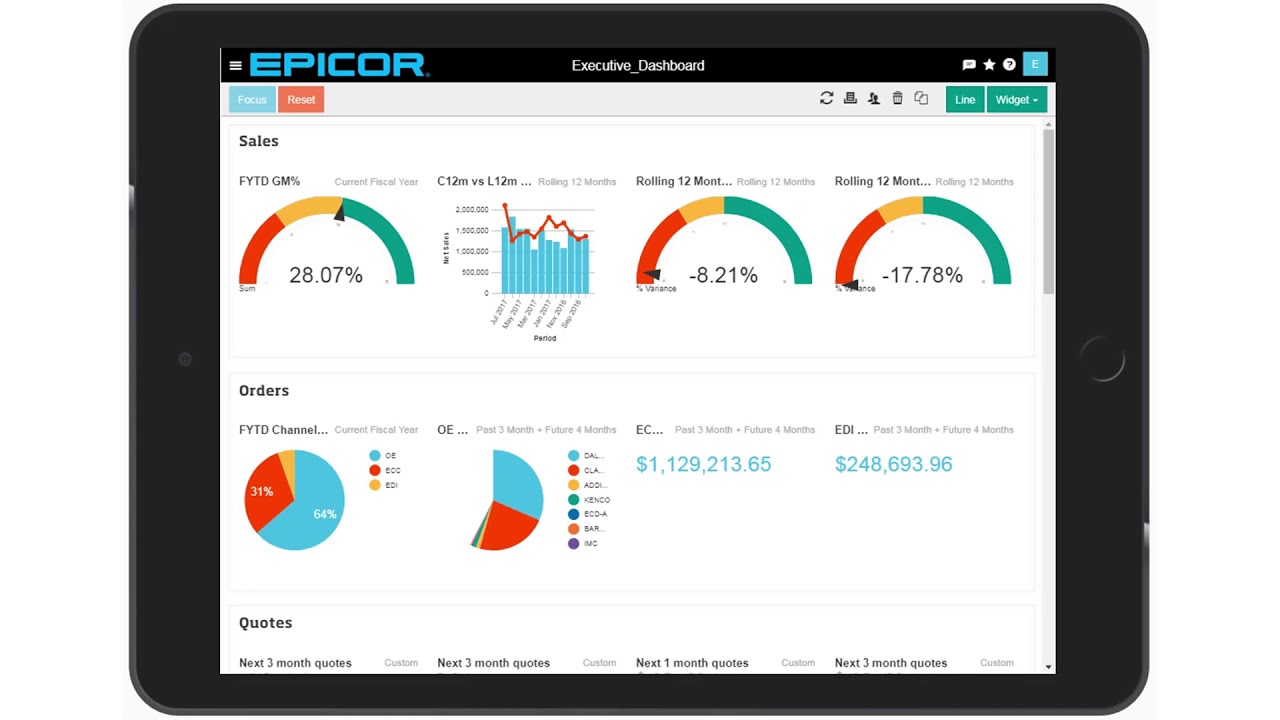
- Build dashboards and trackers to continuously monitor performance;
- Sort, group, summarize and drill down to better understand your data;
- Trace a path from invoice to sales order to job or work order and back; and
- Start with provided template and building your own in the future.
Through Epicor Mattec MES production monitoring, you can capture data directly from machines and operators and get real-time production metrics and analytics. With Epicor Mattec MES, you will:
- Eliminate manual data collection;
- Receive instant alerts for machine conditions, cycle process variations, efficiency and scrap rates;
- Get automated alerts for help calls and preventative maintenance; and
- Improve cycle times, overall equipment effectiveness and plant productivity.
With descriptive analytics, every department can learn from its data with self-service summaries, animated, interactive data visualization, and tools to simplify report creation and sharing. Epicor Data Discovery drills down into live Epicor ERP data to generate visually rich charts that deepen everyone’s understanding of the data. This function keeps everyone focused on the metrics that matter to them with role-based charts and graphs on the Epicor ERP Active Homepage. Users also save time and effort by creating reports directly in Microsoft Excel with Epicor XL Connect.
Epicor ERP also can help you figure out the cause of problems as well as predict the future. With Epicor Data Analytics, users can determine the cause of issues by analyzing large data sets. Planning for success is accomplished through the Epicor Smart Inventory Planning and Optimization Platform. This is a set of cloud-based applications that help drive sales and inventory operations planning to:
- Get a clear perspective on the state of your inventory;
- Select the right forecast model for each item, accounting for trend, seasonality and event; and
- Determining safe stock levels, reorder point, lead times, and order quantity to balance carrying costs and customer service.
Business intelligence and analytics are two key components to the success of a business that no company should ignore. By using Epicor ERP, you’ll be ahead of the competition. 2W Tech is a certified Epicor ERP partner and employs experts in ERP implementation and maintenance. Contact us today for help with your business intelligence and analytics through Epicor ERP.
Read More:
Difference Between Data Security and Data integrity
Mobile Collaboration on the Rise
Best Practices for ERP Success Whitepaper
Enjoyed reading this article? Click the button below to download this asset.
[download asset=”/wp-content/uploads/2016/11/Best-Practices-for-ERP-Success-Whitepaper.pdf” title=”Best Practices for ERP Success Whitepaper”]Download “Best Practices for ERP Success” Now[/download]