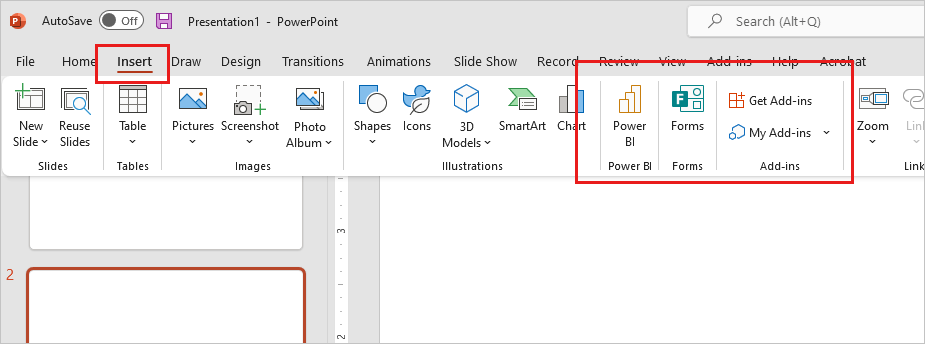
Power BI Enables App Chart Sharing in PowerPoint
Power BI is Microsoft’s business analytics service, and it has announced some new added features within PowerPoint.
Power BI now lets users embed charts from different organizational apps directly into PowerPoint presentations. This feature enhances data storytelling, collaboration, and decision making. These app charts are interactive visualizations that show the hierarchy and relationships of employees within an organization. This new type of Power BI app can be created from the Power BI service or from a basic Excel file.
Users will have the ability to customize the appearance and layouts of the charts. They can also drill down into specific areas of the chart to see more details or explore various scenarios.
The second feature available is the ability to export Power BI reports into PowerPoint slides to easily be used for presentations or sharing with others. The exported slides will retain the formatting and settings of the original report, but it will no longer be interactive or connected to the data source. A user would still be able to edit or add to the slides, just like in any other PowerPoint.
Microsoft also announced that coming soon will be additional features added to the drawing tools in PowerPoint on the web.
Keep up to date with Microsoft Power BI news and announcements by tuning in regularly to:
Read More:
How ERP Systems Keep Pace with Innovation
