Power BI Dashboard Ideas
Microsoft Power BI is a different software services, applications, and connectors that work together to turn your unrelated sources of data into insights you can use to make decisions. This tool allows you to easily connect to your data sources, visualize and discover what information is important to you. A Power BI dashboard is designed to tell a story with visualizations and summaries. It is a well-designed dashboard, only one single page, containing only the highlights of the story that are important to you. More thorough details are available in the related reports.
Businesses can deploy various dashboards for various needs, department by department if necessary.
Here are some dashboard ideas for your business:
- Finance dashboard: This dashboard gives a broad overview of the company’s financial performance throughout time. It lets users explore the financial performance according to area and product category.
- Web analytics dashboard: The goal is to help the marketing division better understand how users interact with their website. It gathers website analytics information and displays it in a more digestible format.
- Customer Satisfaction dashboard: This assists in organizations learning how consumers feel about the service they receive. The insights enable a company to assess if it is aligning service improvements with consumer expectations. It also aids in understanding how well certain service offerings are functioning overall.
- HR dashboard: This is made for HR managers who want to be aware of the workforce’s demographics, track new employees, and make sure diversity standards are being achieved. You can view average income, average tenure, and average age.
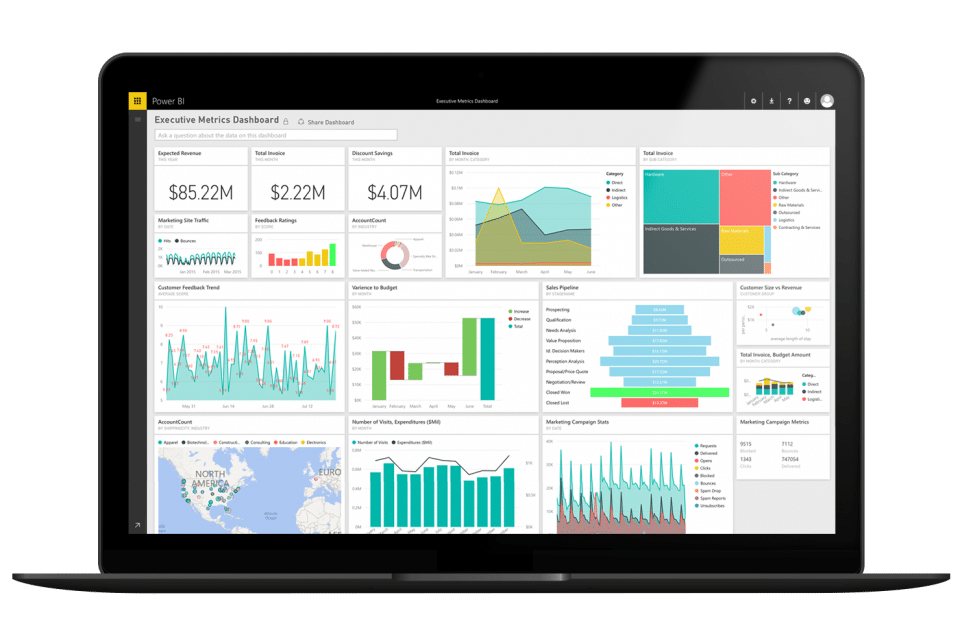
- Executive dashboard: Gives a quick overview of the company’s performance while concentrating primarily on high-level, understandable insights. From this dashboard, the executives can understand how their company has done so far this year. The goal is for executives to monitor important indicators and determine whether they need to dig in to gather more information or if everything is status quo.
- CEO dashboard: This dashboard provides significant KPIs and indicators for the CEO at a high-level. It provides a birds-eye view of the organizations data and company expansion. It also contains information on several crucial company sectors, including inventory, profit sales, performance, orders, outages, and top personnel.
Power BI dashboards are created with a specific dataset in mind that allows each department to customize to their needs. It enables you to connect to and see any data while also integrating visuals into the daily usage apps you use.
Has your business been introduced to Power BI yet? If not, let us help! 2W Tech is a technology solutions provider specializing in solutions geared towards the manufacturing industry. Let our team of expert IT Consultants introduce your business to the cool features of Microsoft Power BI and the different dashboards that you be customizing.
Read More:
Is Your ERP System Providing Greater Visibility
Time to Leverage a Security Operations Center